How to Measure Customer Engagement: A Practical Guide

Let's be honest, "customer engagement" can feel like a fuzzy, hard-to-pin-down concept. But it's actually something you can—and absolutely should—measure. At its core, it's about tracking how people are interacting with your brand over time, across all the places you connect with them.
We're not just talking about clicks and opens here. This is about getting a real, quantifiable sense of how deep your customer relationships go. It's how you measure loyalty, satisfaction, and the long-term health of your business.
Why Should You Bother Measuring Customer Engagement?
If you think of customer engagement as just another vanity metric, you’re missing the bigger picture. It's the pulse of your customer relationships. When engagement is high, it's a clear sign that you're delivering real value, well beyond a single purchase. It’s what separates a one-time buyer from someone who will champion your brand for years.
Once you get a handle on measuring engagement, you gain an almost predictive ability. You start to see what your customers need before they ask, spot the accounts that are about to churn, and find new ways to boost your overall Customer Lifetime Value (CLV).
From Numbers to Business Results
The real breakthrough comes when you link engagement data to actual business outcomes.
Take a software company, for example. They might dig into their data and find that users who try a specific new feature within the first week are 80% less likely to cancel. That's a game-changer. Now, their customer success team knows exactly what to do: guide new users to that feature and get them to their "aha!" moment faster, directly improving retention.
Or think about an e-commerce store. By looking at purchase frequency, they can tailor their marketing. If a customer typically buys every 30 days, sending a friendly reminder email on day 28 feels like helpful service, not spam. This is a simple, data-driven action that encourages repeat business and builds genuine loyalty.
"Ignoring engagement metrics is like trying to navigate without a map. You might be moving, but you have no idea if you're getting closer to your destination or heading toward a cliff."
It’s All About Proactive Strategy
Ultimately, measuring engagement shifts your entire strategy from reactive to proactive. Instead of just putting out fires when customers complain or leave, you start to see the patterns that tell you if someone is happy or getting frustrated. This ability to get ahead of problems is a massive competitive advantage.
This isn't just a niche idea; it’s where business is heading. The global market for customer engagement solutions was valued at around USD 23.45 billion in 2023 and is expected to hit USD 50.03 billion by 2030.
This explosive growth points to one simple truth: the companies that are winning are the ones investing in understanding and improving every single customer interaction. If you want to dive deeper, you can learn more about these customer engagement metric trends. It's a fundamental shift in how great companies build relationships that last.
Choosing the Right Engagement Metrics
So, you're sold on the idea of measuring customer engagement. The big question is, what should you actually be tracking? It's incredibly easy to drown in data, and frankly, most of it is just noise. The real trick is to pick the metrics that tell you a story about how your customers are interacting with you.
What works for a SaaS company won't be the same for an e-commerce store. If you're selling software, you’ll probably be obsessed with feature adoption rates to see who your power users are. But if you're running an online shop, purchase frequency is your bread and butter for building a loyal customer base. The goal is to build a dashboard that actually reflects your business and the journey your customers take.
This visual breaks down how tracking engagement helps you anticipate customer needs, stop churn before it happens, and ultimately increase customer value.
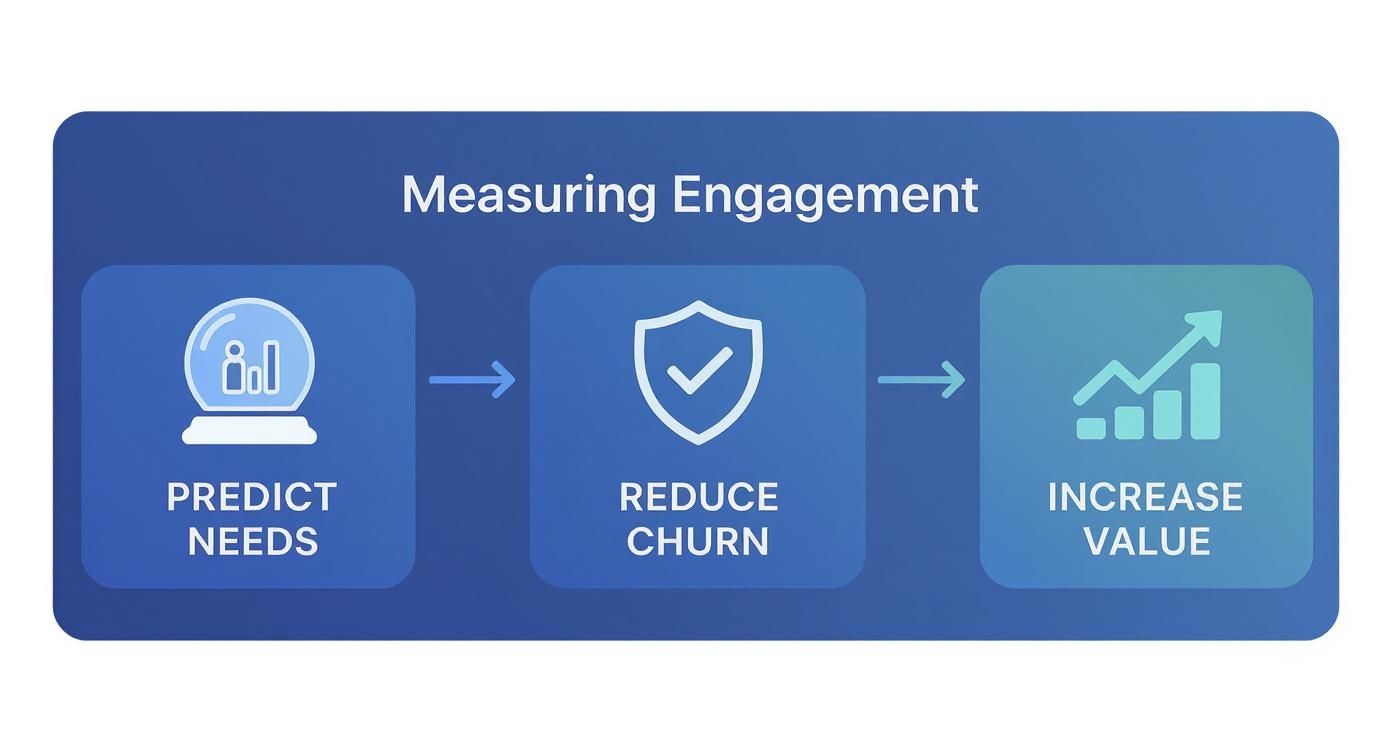
It’s a great reminder that this isn't just about looking at past performance. It’s about using that data to make better decisions for the future.
To help you get started, I've put together a table that breaks down some of the most crucial metrics. Think of this as your cheat sheet for understanding what to track and why it matters.
Key Customer Engagement Metrics and What They Reveal
| Metric Category | Metric Name | What It Measures | Common Tools to Track |
|---|---|---|---|
| Behavioral | Session Duration | The average length of time visitors spend on your site during a single visit. | Google Analytics, Matomo |
| Behavioral | Feature Adoption Rate | The percentage of users who actively use a specific product feature. | Pendo, Amplitude |
| Behavioral | Purchase Frequency | How often a customer makes a repeat purchase within a specific timeframe. | Your e-commerce platform (e.g., Shopify, BigCommerce) |
| Attitudinal/Sentiment | Net Promoter Score (NPS) | Customer loyalty and willingness to recommend your brand to others. | SurveyMonkey, Typeform |
| Attitudinal/Sentiment | Customer Satisfaction (CSAT) | Short-term happiness with a specific product, service, or interaction. | Zendesk, Help Scout, Delighted |
This table gives you a solid foundation, showing a mix of metrics that track both what customers do and how they feel. Combining them is where you get the full picture.
Behavioral Metrics: What People Are Doing
These metrics are all about action. They give you the hard data on how people are actually using your website, app, or product. This isn't about feelings; it's about clicks, scrolls, and purchases.
Here are a few heavy hitters:
- Session Duration & Pages Per Session: Are people sticking around, or are they bouncing right away? Longer sessions and more pages visited usually mean you’re giving them something they find valuable.
- Feature Adoption Rate: This is pure gold for SaaS businesses. If you just launched a new feature, this metric tells you if anyone is actually using it. If the rate is low, it might be a sign you need to improve your onboarding or tutorials.
- Purchase Frequency: For any e-commerce brand, this is a direct line to customer loyalty. It answers a simple question: are my customers coming back for more?
Attitudinal Metrics: How People Are Feeling
While behavioral data tells you what happened, attitudinal metrics tell you why. These get to the heart of how customers feel about your brand, their satisfaction levels, and their overall loyalty.
You usually need to ask for this information directly through surveys and feedback forms.
- Net Promoter Score (NPS): The classic "How likely are you to recommend us?" question, answered on a scale of 0-10. It's one of the best indicators you have for overall brand health and customer loyalty.
- Customer Satisfaction (CSAT): This is more of an in-the-moment check. You typically send a CSAT survey right after a customer interacts with your support team to get immediate feedback on that specific experience. For a deeper dive, our guide on customer satisfaction measurement methods has some great tips.
A high NPS score is a great ego boost, but the real magic is in the follow-up question: "Why did you give that score?" That open-ended feedback is where you'll find the specific, actionable insights that can truly move the needle.
At the end of the day, a holistic view is what you're after. You need to blend the "what" from behavioral data with the "why" from customer sentiment. If you’re looking to get even more granular, exploring some key content performance metrics can help you connect the dots between your content and audience interaction. This combined approach is how you truly master measuring customer engagement.
Building Your Engagement Tracking Toolkit
Knowing which metrics matter is one thing, but you can't measure anything without the right tools. Putting together a solid tracking toolkit isn't about finding one magical platform that does it all. It’s more about layering different tools to get a complete, 360-degree view of how your customers are behaving and what they’re thinking. This is how you turn abstract metrics into real data you can actually use.
The end game here is to build a connected system. When your tools can talk to each other, you break down the walls that usually stand between marketing, sales, and support. Suddenly, you can see the entire customer journey in one place, from their first click on your website to their most recent support chat.
Foundational and Specialized Platforms
You have to start with a solid foundation. For most of us, that's a web analytics platform like Google Analytics 4 (GA4). Think of it as the workhorse for understanding what’s happening on your site—it tracks things like session duration, page views, and key conversion events. It gives you the answer to the big question: "What are people actually doing on my website?"
Once you have that baseline, you can start adding more specialized tools to dig deeper.
- Customer Relationship Management (CRM): A CRM like HubSpot or Salesforce acts as your command center for all customer data. It logs every single interaction someone has with your company, giving you the full story from when they were just a lead to now being a loyal customer.
- Product Analytics: If you run a SaaS company or have an app, tools like Mixpanel or Amplitude are non-negotiable. They move beyond simple page views and show you exactly how people engage with your product's features, flagging what they love and where they get stuck.
- Behavioral Analytics: This is where you get the "why." Tools like Hotjar provide qualitative insights by literally showing you how users experience your site. With heatmaps, session recordings, and on-site polls, you can finally understand the human behavior behind the cold, hard numbers.
For instance, a Hotjar dashboard can give you a visual map of where people are clicking and scrolling. You can immediately spot which parts of a page are grabbing attention.
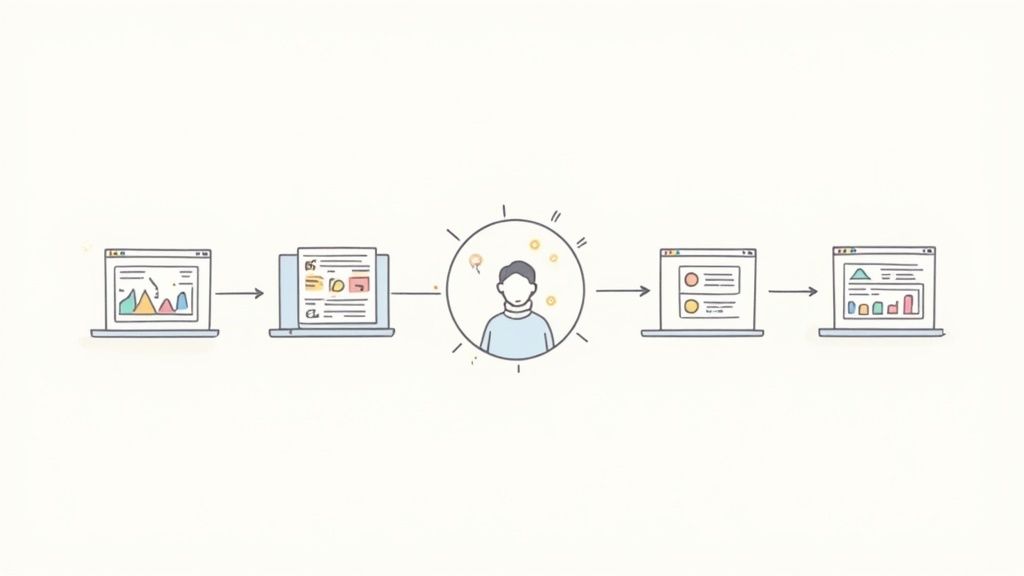
This kind of visual feedback is priceless. It tells you in a second what content is working and what’s just getting ignored.
Capturing Customer Voice and Sentiment
Your analytics data tells you what happened, but it rarely tells you why. That’s where you need to listen directly to your customers.
One of the biggest mistakes I see is businesses relying only on behavioral data. You might see a user visited your pricing page five times, but you'll never know they left because they found it confusing unless you actually ask them.
Survey tools are perfect for this. Platforms like Typeform or SurveyMonkey make it incredibly easy to send out NPS, CSAT, or other custom surveys to collect that direct feedback. For a more detailed look, exploring different customer feedback collection tools can help you find the right fit, whether you need simple one-question polls or more in-depth questionnaires.
When you bring all of this together, the picture becomes crystal clear. Your GA4 data might show a high drop-off rate during checkout. Then, a Hotjar recording reveals a broken button on mobile devices. And finally, a survey response confirms a user's frustration. That's how you connect the dots—and turn measurement into meaningful action.
Turning Engagement Data into Actionable Insights
So, you’ve got the data. Great. But collecting numbers is the easy part. The real magic happens when you turn that raw data into a story that tells you what your customers are really doing and why. Honestly, a pile of metrics is just noise until you connect it to a real business goal.
This is where you shift from just looking at reports to actually building a strategy. Instead of just seeing a 10% drop in session duration and shrugging, you start digging deeper. Are people finding what they need faster? That's a win. Or are they bouncing in frustration? That's a problem. Context is everything.

Uncovering Trends Through Segmentation
One of the most powerful things you can do is segmentation. Looking at your metrics as one big site-wide average is a recipe for disaster because averages hide the truth. They smooth over the important details about how different groups of customers behave.
Let's say your Daily Active Users (DAU) metric suddenly tanks. Panic mode, right? Not so fast. By segmenting the data, you can pinpoint the real issue.
- User Demographics: Is the drop coming from a specific country or age group?
- Device Type: Are mobile users the ones disappearing? Maybe a recent app update is buggy.
- Acquisition Channel: Did all the new users from that last marketing campaign vanish? Perhaps the ad promised something the product doesn't deliver.
By slicing your data this way, you might find that the entire drop is from Android users on the latest app version. Now you don't have a vague, scary problem; you have a specific, fixable bug. If you want to get really good at this, understanding the fundamentals of customer behavior analytics is a game-changer.
Creating a Custom Engagement Score
Once you're comfortable with the individual metrics, you can level up by creating a custom engagement score. Think of it as a single health score for each customer, giving you an at-a-glance view of who's thriving and who's fading away.
Here’s how you build one. You basically assign points to different user actions based on how valuable they are to your business.
- First, define the key actions that matter. This could be anything from logging in and using a core feature to watching a tutorial or making a second purchase.
- Next, assign weights to these actions. A repeat purchase is obviously worth more than a daily login, so give it more points.
- Finally, calculate the score for each user by adding up their points over a set period, like the last 30 days.
This simple scoring system can instantly tell you who your power users are and who might be about to churn.
A customer with a score of 95 is likely a brand advocate you can learn from. A customer with a score of 15? They probably need a nudge from your re-engagement campaign, and fast.
You can even set up alerts. Imagine your customer success team getting an automatic notification the moment a high-value account’s score dips below a certain point. This allows them to step in and help before it's too late. It’s a super practical way to make your data do the heavy lifting for you every single day.
To make this crystal clear, here’s how you can translate a metric into a real-world business decision.
From Data Point to Business Action
| Engagement Metric Observed | Potential Insight | Example Actionable Step |
|---|---|---|
| High bounce rate on a key landing page | The page isn't meeting visitor expectations, or the call-to-action is unclear. | A/B test a new headline and CTA button to see if it improves conversions. |
| Low feature adoption for a new tool | Users might not know the feature exists, or they don't understand its value. | Launch an in-app tour highlighting the new feature and send an email campaign explaining its benefits. |
| Customers repeatedly visiting the pricing page but not converting | The pricing might be confusing, or there's a missing piece of information. | Add a detailed FAQ section to the pricing page or offer a live chat option to answer questions in real-time. |
| Significant drop-off during the onboarding flow | A specific step in the onboarding process is likely too complex or frustrating. | Analyze session recordings of the onboarding flow to identify the friction point and simplify that step. |
Connecting the dots between what the data says and what you should do is what separates good analysis from great strategy. These examples show how a single observation can lead directly to a smart business move.
How AI Is Changing Engagement Measurement
The old rules for measuring customer engagement are being rewritten, and artificial intelligence is holding the pen. AI isn't some far-off concept anymore; it's a practical tool that's fundamentally changing how we understand our users. It helps us move beyond simply looking at past data and start predicting what will happen next.
Think about it this way: instead of just tracking past behavior, AI models can forecast future actions. Imagine a system that flags a customer as a churn risk not after they’ve disappeared, but the moment their activity starts to subtly change. This gives you a chance to step in with the right kind of support or a special offer, stopping churn before it even starts.
Practical AI Applications You Can Use Today
What makes AI so powerful is its ability to make sense of massive, messy datasets that were once impossible to analyze. This unlocks a much deeper understanding of how your customers truly feel and what they need.
Here are a couple of ways this is already happening:
- Sentiment Analysis: AI tools can instantly scan thousands of customer reviews, support tickets, and social media mentions. They don't just count keywords; they analyze the language to determine if the sentiment is positive, negative, or neutral. This gives you a real-time pulse on customer happiness without needing a team to read every single comment.
- AI-Driven Personalization: We're moving way past basic "if-then" rules. AI can adapt a user's experience on the fly based on their clicks, how long they stay, and what they look at. This creates a genuinely dynamic and personal journey for every single person.
For example, an e-commerce site using AI can completely rearrange its homepage for different visitors. Someone who keeps looking at running shoes will automatically see more running-related content—from new shoe drops to blog posts about training. That’s a far more engaging experience than a generic, one-size-fits-all page.
Automation and the Future of Interaction
AI’s role is only going to get bigger. By 2025, it’s expected that AI will power 95% of all customer interactions. We’re already seeing this shift with intelligent chatbots and automated support systems becoming standard.
In fact, around 71% of business leaders are planning to invest more in AI chatbots to improve their customer support. If you want to dive deeper, you can discover more insights about AI in customer engagement.
Ultimately, bringing AI into your engagement measurement strategy lets you analyze data at a scale and depth we couldn't have imagined just a few years ago. It helps you find those hidden patterns in customer behavior, automate your responses, and create truly personalized experiences. It turns your data from a history report into a powerful strategic asset.
Common Questions About Measuring Engagement
When you dive into customer engagement data, certain questions almost always pop up. Clearing those doubts early helps you stay focused on what really moves the needle.
Below, I walk through four areas where teams often get stuck—and share practical tips to keep you on track.
How Often Should I Review My Engagement Metrics?
Finding the right rhythm depends on what you’re tracking and how fast your business moves.
- Daily or Weekly Reviews for fast-moving signals: Daily Active Users (DAU), session duration, feature adoption rates. Right after a product launch or marketing push, these numbers tell you what’s resonating.
- Quarterly Check-Ins for big-picture metrics: Net Promoter Score (NPS) and Customer Lifetime Value (CLV). Reviewing these too often can lead to knee-jerk reactions over small swings.
The trick is consistency. Stick to a schedule so you spot real trends instead of chasing every blip.
What Is The Difference Between Engagement And Satisfaction?
Customer satisfaction measures a single interaction—did that support ticket or purchase go smoothly?
Engagement tracks the ongoing relationship and all those touchpoints over time.
Imagine grabbing a coffee you love—it brightens your morning, but it doesn’t mean you’ll come back every day. Engagement builds over multiple experiences, and while engaged customers are usually satisfied, one happy moment won’t lock in loyalty.
Which Single Metric Is Most Important?
There’s no one-size-fits-all figure. Your most valuable metric ties directly to your business model.
- In SaaS, feature adoption rate often reflects product value.
- For e-commerce, purchase frequency shows how often buyers return.
Rather than hunt a solitary stat, assign a primary metric to each journey stage—activation, retention, referral. That way, you get a full view of performance and priorities.
How Can A Small Business Start Measuring Engagement?
You don’t need a huge budget to begin. Simple tools can yield big insights.
- Link up Google Analytics 4 to capture session duration, page views, and conversion paths.
- Create a quick NPS survey in Google Forms and send it to your email list.
- Focus on gathering any data you can—early wins set a strong foundation for growth.
If you want to boost engagement without writing a line of code, Yoonoo has you covered. Launch a chatbot in under five minutes, start answering customer questions instantly, and provide support 24/7. Build your free chatbot today at Yoonoo.ai and watch your engagement soar!